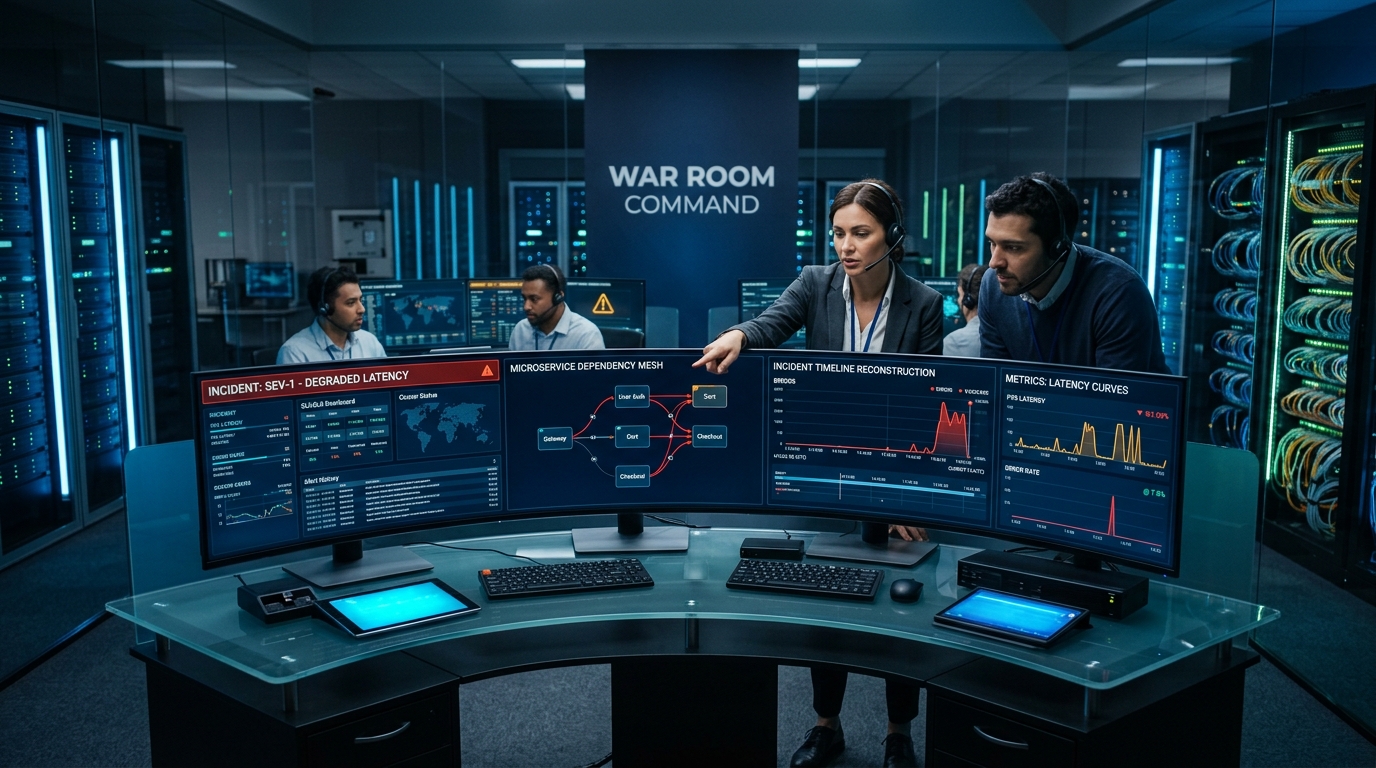
At 02:14 UTC on a Saturday morning, a database migration script failed silently across a multi-region cluster. By 02:22 UTC, connection pools starved, upstream API gateways began returning HTTP 504s, and payment transactions plummeted to zero.
A sleep-deprived on-call engineer scrambled to mitigate the cascading collapse. Under intense pressure, they executed what they believed to be a targeted rollback command, inadvertently dropping a shared routing table. Downtime stretched from twenty minutes into three agonizing hours.
The following Monday morning, leadership faces a pivotal crossroads that will define the engineering organization for years to come:
- Path A (The Retributive Trap): Conduct an interrogation to identify who made the mistake. Revoke the engineer’s production access, mandate a bureaucratic three-person sign-off for future migrations, and write off the catastrophe as “human error.”
- Path B (The Blameless Resilience Path): Recognize that human error is never the root cause of a failure; it is merely the symptom of underlying systemic vulnerabilities. Investigate why a single CLI command could catastrophically orphan production routing, why our CI/CD pipeline validated a dangerous migration script, and how we can engineer self-healing guardrails that make this failure class impossible.
Organizations that choose Path A cultivate cultures of fear, secrecy, delayed escalations, and repeated outages. Organizations that embrace Path B build robust, fault-tolerant sociotechnical systems that thrive under adversity.
This guide is an end-to-end, battle-tested blueprint for establishing modern, blameless incident response and post-mortem operations. We will examine the cognitive science behind human error, deconstruct the Incident Command System (ICS), analyze stakeholder and C-level communications, walk through two visceral production war stories with working resilience code, analyze facilitator conversational scripts, and provide production-ready automation scripts and alerting configurations you can deploy immediately.
1. The Fallacy of “Human Error”: Why Blame Destroys Reliability
In safety science and complex systems engineering, few concepts are as misunderstood as “human error.” Whenever an outage occurs, the easiest and most intellectually lazy conclusion is: “The system worked fine until an engineer made a blunder.”
In his seminal work The Field Guide to Understanding ‘Human Error’, cognitive psychologist and safety researcher Sidney Dekker describes two competing perspectives:
+---------------------------------------------------------------------------------------------------+
|                                  THE TWO VIEWS OF SYSTEM FAILURE                                  |
|                                                                                                   |
|   THE OLD VIEW ("The Bad Apple Theory")         THE NEW VIEW ("Systems Resilience Theory")        |
|                                                                                                   |
|   - Complex systems are inherently safe.        - Complex systems are inherently hazardous and    |
|   - Failures are caused by erratic, careless,     full of latent contradictions.                  |
|     or unreliable human operators.              - Human operators are the primary source of       |
|   - The remedy: Discipline, retrain, or           adaptability, safety, and system resilience.    |
|     restrict permissions of the individual.     - The remedy: Understand the systemic pressures,  |
|   - Outcome: People conceal errors, near-         flawed tools, and missing signals that made     |
|     misses go unreported, risk accumulates.       the action seem reasonable at the time.         |
|                                                 - Outcome: Psychological safety, deep telemetry,  |
|                                                   and self-healing architecture.                  |
+---------------------------------------------------------------------------------------------------+
The Local Rationality Principle
A foundational tenet of resilience engineering is the Local Rationality Principle:
At the moment someone took an action, their choice made complete sense given the information, tools, goals, cognitive load, and environmental pressures they faced.
Engineers never wake up and think: “Today, I am going to drop the production database and bankrupt our checkout funnel.”
When an engineer runs an erroneous command, they do so because:
- The shell prompt didn’t distinguish production from staging.
- The deployment tooling lacked a dry-run confirmation mode.
- The internal wiki documentation was out-of-date and inaccurate.
- Monitoring alerts were flooded with noisy, false-positive alarms.
- Management pressured the team to meet an aggressive deadline without adequate testing windows.
If you fire or reprimand the engineer, you have altered zero lines of defective code, improved zero monitoring dashboards, and fixed zero architectural hazards. The booby trap remains set—waiting for the next person to step on it.
The Lethal Cost of Blame
Blame is not merely unjust—it is an active threat to operational availability. When an organization penalizes engineers for mistakes:
- Incident Escalation is Delayed: Engineers spend critical minutes attempting to secretly fix an issue before anyone notices, causing small anomalies to balloon into SEV-1 disasters.
- Telemetry is Censored: Scribes and responders scrub Slack channels, delete shell histories, and withhold crucial observations out of fear of retrospective punishment.
- Near-Misses are Buried: High-performing organizations treat near-misses as free learning opportunities. Blame-heavy cultures sweep them under the rug until they cause a total blackout.
2. Cognitive Biases in Incident Analysis
Post-mortems often derail not because engineers are malicious, but because human psychology is subject to predictable cognitive traps:
+-----------------------------------------------------------------------------------------------+
|                                COGNITIVE BIASES IN POST-MORTEMS                               |
|                                                                                               |
|   HINDSIGHT BIAS               OUTCOME BIAS                 FUNDAMENTAL ATTRIBUTION ERROR     |
|   "It was so obvious!"         "That deploy was reckless!"  "They were just negligent."       |
|                                                                                               |
|   Looking backward from a      Judging the quality of a     Attributing someone's failure to  |
|   known outcome makes the      decision solely by its       character flaws while attributing |
|   chain of events look         eventual result rather than  our own failures to situational   |
|   inevitable and foreseeable.  the information available.   context and constraints.          |
+-----------------------------------------------------------------------------------------------+
1. Hindsight Bias
Once we know that line 42 had an off-by-one bug that crashed the cluster, it seems incomprehensible that the author and reviewers didn’t notice it. But during code review, line 42 was one of 1,200 lines across 35 files reviewed in the context of sprint deliverables. In hindsight, all signals are clear; in foresight, signals are drowned in noise.
2. Outcome Bias
If an engineer runs an undocumented hotfix command on a production node and it successfully fixes a customer issue, they are praised as a hero. If that exact same command unexpectedly locks an InnoDB table and halts the API, they are condemned as reckless. The action was identical; only the probabilistic outcome varied.
3. The Fallacy of the “Single Root Cause”
Complex distributed systems never fail due to a single isolated event. As Dr. Richard Cook demonstrated in his landmark paper How Complex Systems Fail:
Complex systems are intrinsically and continuously operating in degraded mode. Catastrophe requires multiple concurrent failures that breach layered defenses.
When post-mortems search for “The Root Cause,” they oversimplify reality. A real-world outage is almost always an intersection of latent conditions: an obscure race condition + unexpected traffic volume + a degraded network switch + an ambiguous dashboard metric.
3. The Modern Incident Lifecycle & Alerting on SLOs
To manage production crises effectively, organizations must treat incidents as structured operational lifecycles rather than chaotic firefighting drills.
+------------------------------------------------------------------------------------------------------------------------+
|                                              THE FULL INCIDENT LIFECYCLE                                               |
|                                                                                                                        |
|   [ DETECT ]          [ TRIAGE ]          [ MOBILIZE ]         [ STABILIZE ]        [ RESOLVE ]        [ LEARN ]       |
|   SLO/Alert fires  -> Assess severity  -> Spin up incident  -> Contain damage   -> Verify steady   -> Blameless        |
|   or customer         and blast           command & war        (mitigate over      state & teardown   Post-Mortem &    |
|   reports anomaly     radius (SEV 1-4)    room channel         root-cause debug)   war room           Action Items     |
|                                                                                                                        |
|   <--- MTTD --->      <--- MTTA --->      <-------------- MTTR / MTTM ------------->                  <--- Learning -> |
+------------------------------------------------------------------------------------------------------------------------+
Key Metrics Defined:
- MTTD (Mean Time to Detect): Time from system degradation to the first automated alert or notification.
- MTTA (Mean Time to Acknowledge): Time from alert delivery to an engineer initiating investigation.
- MTTM (Mean Time to Mitigate): Time from investigation kickoff to restoring service to acceptable thresholds (often via rollbacks or traffic shedding, prior to permanent bug fixing).
- MTTR (Mean Time to Resolve): Time to complete permanent remediation and system validation.
Precision Detection: Multi-Window Multi-Burn-Rate Alerting
One of the largest contributors to on-call burnout and delayed detection is poor alerting design. Static thresholds (e.g., error_rate > 1%) either wake up engineers for fleeting 10-second blips or fail to detect a slow 0.5% failure that steadily drains customer trust.
The industry gold standard—formalized in the Google SRE Handbook—is Multi-Window Multi-Burn-Rate Alerting. Instead of measuring raw thresholds, we alert on how fast we are consuming our Service Level Objective (SLO) Error Budget:
+--------------------------------------------------------------------------------------------------+
|                            ERROR BUDGET BURN RATE ALERT MATRIX (30-DAY SLO)                      |
|                                                                                                  |
|  BURN RATE  | % BUDGET CONSUMED | TIME TO 100% EXHAUSTION | SEVERITY | NOTIFICATION CHANNEL      |
|  14.4x      | 2% in 1 hour      | 2 days                  | SEV-1    | Immediate PagerDuty Page  |
|  6.0x       | 5% in 6 hours     | 5 days                  | SEV-2    | PagerDuty (Next 15m)      |
|  1.0x       | 10% in 3 days     | 30 days                 | SEV-3    | Slack Ticket / Daily Ops  |
+--------------------------------------------------------------------------------------------------+
To avoid flapping, modern rules require both a short window and a long window to agree before firing. Below is a production Prometheus Alertmanager configuration implementing both SEV-1 and SEV-2 burn rates:
# /etc/prometheus/rules/slo_alerts.yml
groups:
  - name: API_SLO_Alerts
    rules:
      # ========================================================================
      # SEV-1: Critical Burn Rate (14.4x over 1 hour) -> Consumes 2% budget in 1h
      # ========================================================================
      - alert: CheckoutAPICriticalBurnRate
        expr: |
          (
            sum(rate(http_requests_total{job="checkout-api", status=~"5.."}[1h]))
            /
            (sum(rate(http_requests_total{job="checkout-api"}[1h])) > 0)
          ) > (14.4 * (1 - 0.999))
          and
          (
            sum(rate(http_requests_total{job="checkout-api", status=~"5.."}[5m]))
            /
            (sum(rate(http_requests_total{job="checkout-api"}[5m])) > 0)
          ) > (14.4 * (1 - 0.999))
        for: 2m
        labels:
          severity: critical
          incident_tier: SEV-1
        annotations:
          summary: "Checkout API Error Budget Burning at 14.4x"
          description: "Service is burning 2% of monthly error budget per hour. High probability of complete exhaustion within 48 hours."
          runbook_url: "https://wiki.internal.net/ops/runbooks/checkout-api-degradation"

      # ========================================================================
      # SEV-2: Severe Burn Rate (6.0x over 6 hours) -> Consumes 5% budget in 6h
      # ========================================================================
      - alert: CheckoutAPISevereBurnRate
        expr: |
          (
            sum(rate(http_requests_total{job="checkout-api", status=~"5.."}[6h]))
            /
            (sum(rate(http_requests_total{job="checkout-api"}[6h])) > 0)
          ) > (6.0 * (1 - 0.999))
          and
          (
            sum(rate(http_requests_total{job="checkout-api", status=~"5.."}[30m]))
            /
            (sum(rate(http_requests_total{job="checkout-api"}[30m])) > 0)
          ) > (6.0 * (1 - 0.999))
        for: 5m
        labels:
          severity: warning
          incident_tier: SEV-2
        annotations:
          summary: "Checkout API Error Budget Burning at 6.0x"
          description: "Service is burning 5% of monthly error budget over 6 hours. Investigation required before budget exhausts."
          runbook_url: "https://wiki.internal.net/ops/runbooks/checkout-api-degradation"
4. Operational Incident Command: Roles and Protocols
When a high-severity incident strikes, consensus-driven engineering must temporarily pause in favor of the Incident Command System (ICS)—a battle-tested organizational methodology adapted from emergency response and disaster services.
                             +-------------------------------------+
                             |         INCIDENT COMMANDER          |
                             |  Directs strategy, allocates roles, |
                             |  guards tempo, holds the pen        |
                             +------------------+------------------+
                                                |
                 +------------------------------+------------------------------+
                 |                                                             |
+--------------------------------+                            +--------------------------------+
|        OPERATIONS LEAD         |                            |       COMMUNICATIONS LEAD      |
|  Directs technical diagnosis,  |                            |  Maintains internal stakeholder|
|  coordinates responders,       |                            |  updates and public status page|
|  evaluates hypotheses          |                            +--------------------------------+
+----------------+---------------+                                             |
                 |                                            +--------------------------------+
+----------------+---------------+                            |             SCRIBE             |
|       SUBJECT MATTER EXPERTS   |                            |  Chronicles timeline, commands,|
|  DBAs, NetEng, Backend, Infra  |                            |  decisions, and dashboards     |
+--------------------------------+                            +--------------------------------+
The Golden Rule: The Incident Commander Never Debugs
The most common failure mode in technical incident management is the Incident Commander (IC) opening a terminal window to run strace or inspect Kubernetes logs.
The moment an IC begins troubleshooting, they lose situational awareness. They miss incoming messages, fail to detect that another engineer is pursuing an uncoordinated mitigation, and forget to keep executive and public stakeholders informed. The IC coordinates; the Ops Lead investigates.
Role Definitions
| Role | Primary Responsibility | Anti-Patterns to Avoid |
|---|---|---|
| Incident Commander (IC) | Owns the incident process. Sets cadence, authorizes mitigations, resolves disputes, prevents tunnel vision. | Do not troubleshoot, execute commands, or write code. Do not panic or micromanage technical leads. |
| Operations Lead (Ops Lead) | Coordinates technical response. Assigns investigative tracks to Subject Matter Experts (SMEs), synthesizes data. | Do not change configurations without IC consent. Do not pursue pet hypotheses without data. |
| Communications Lead | Translates technical findings into clear, empathetic updates for executives, customer support, and public status pages. | Do not speculate on resolution ETAs. Do not broadcast internal jargon to customers. |
| Scribe | Maintains an immutable chronological log of actions, hypotheses, graphs, and command executions in the war room. | Do not editorialize or evaluate actions; record timestamps and exact observations dispassionately. |
Severity Classification Matrix
Establishing an objective, unambiguous severity framework eliminates debate over whether an issue warrants waking up an engineering lead at 3:00 AM:
+----------+------------------------------------------------------------+-----------------------+---------------------+
| SEVERITY | DEFINITION & USER IMPACT                                   | ESCALATION CADENCE    | UPDATE FREQUENCY    |
+----------+------------------------------------------------------------+-----------------------+---------------------+
|  SEV-1   | Critical business outage. Core functionality down for all  | Immediate page to     | Internal: Every 15m |
| (Outage) | or majority of users. Direct revenue/data loss risk.       | Execs, IC, On-Call    | Public: Every 30m   |
+----------+------------------------------------------------------------+-----------------------+---------------------+
|  SEV-2   | Severe degradation. Significant feature broken for subset  | Page primary team     | Internal: Every 30m |
| (Major)  | of users; viable workarounds exist but are degraded.       | and domain SMEs       | Public: Hourly      |
+----------+------------------------------------------------------------+-----------------------+---------------------+
|  SEV-3   | Minor impairment. Non-critical functionality impacted      | Notify relevant team  | Daily or at next    |
| (Minor)  | without noticeable business impact or revenue loss.        | via standard ticket   | business day        |
+----------+------------------------------------------------------------+-----------------------+---------------------+
|  SEV-4   | Cosmetic flaw, internal tool friction, or low-priority bug| Standard backlog      | Standard sprint     |
| (Cosmetic| with negligible user impact.                               | planning process      | cadence             |
+----------+------------------------------------------------------------+-----------------------+---------------------+
5. Tactical Containment vs. Root-Cause Hunting
When a building is ablaze, firefighters do not analyze the blueprint to evaluate electrical junction insulation—they extinguish the fire and rescue occupants.
In software engineering, responders frequently fall into the Diagnostic Trap: spending hours attempting to deduce why a specific memory leak appeared, while users continue to face a complete site outage.
                              THE MITIGATION DECISION FORK
                                           |
                                [ Incident Declared ]
                                           |
                    +----------------------+----------------------+
                    |                                             |
          [ DIAGNOSTIC TRAP ]                           [ BLAMELESS SRE WAY ]
          - Attach GDB to prod pods                     - Roll back deployment immediately
          - Dump heap to analyze GC                     - Flip feature flags to fallback mode
          - Inspect commit-by-commit diffs              - Shed non-critical traffic
                    |                                             |
          Users suffer 3 hours of outage                Service restored in 7 minutes
                    |                                             |
          Exhausted team, delayed recovery              Investigate offline with heap dumps
Practical Containment Playbook:
- Roll Back First: If an incident coincided with a deployment, rolling back to the last known healthy release should be the immediate default—before analyzing the code diff.
- Feature Flags as Circuit Breakers: Wrap high-risk services, new database access layers, and third-party integrations in dynamic feature flags that can be disabled within seconds.
- Graceful Degradation & Shedding: Drop non-essential workloads (e.g., search autocomplete, image re-compression, analytics pings) using rate limiters and API gateways to conserve CPU/database capacity for mission-critical paths.
- Traffic Rerouting: Shift traffic to an alternate cloud region or standby cluster via global DNS or Anycast BGP routing.
6. Production War Story 1: “The Midnight Thundering Herd”
To understand how blameless culture bridges the gap between chaotic firefighting and long-term architectural fortification, let’s analyze an actual distributed systems failure.
The Architecture & The Collapse
- Stack: Go microservices on Kubernetes, Redis cluster for catalog caching, PostgreSQL cluster for transactions.
- The Failure: At 23:45 UTC, API latency surged from 35ms to 14,000ms. Error rates crossed 70%.
[ Incoming User Traffic ]
            |
            v
   [ Traefik Ingress ]
            |
            v
   [ 40 Go API Pods ]
       |             |
       | (Cache Hit) | (Cache Miss)
       v             v
 [ Redis Cluster ]  [ PostgreSQL Master ]  <--- EXHAUSTION POINT!
 (Keys Expired)     (Max Connections 500 reached, 100% CPU lock)
The on-call engineer inspected the database, observed connection saturation, and restarted PostgreSQL. The database immediately re-saturated within 10 seconds of coming back online.
Blameless Investigation & The Architectural Remediation
Rather than scolding the engineer for restarting Postgres or blaming the developer who pushed an unjittered cache script, the team identified three systemic vulnerabilities and implemented permanent engineering controls:
1. Request Coalescing with singleflight
When 5,000 concurrent requests ask for the same expired product page, the API pods should not launch 5,000 queries against PostgreSQL. Using Go’s singleflight.Group, we ensure that only one query hits the database while the other 4,999 requests await the result:
// internal/catalog/service.go
package catalog

import (
    "context"
    "fmt"
    "time"
    "golang.org/x/sync/singleflight"
)

type CatalogService struct {
    cache   CacheClient
    db      DatabaseClient
    sfGroup singleflight.Group
}

func (s *CatalogService) GetProduct(ctx context.Context, id string) (*Product, error) {
    cacheKey := fmt.Sprintf("product:%s", id)

    // 1. Attempt Cache Lookup
    if val, err := s.cache.Get(ctx, cacheKey); err == nil {
        return val, nil
    }

    // 2. Coalesce concurrent cache-miss queries into a single database hit
    val, err, _ := s.sfGroup.Do(cacheKey, func() (interface{}, error) {
        prod, dbErr := s.db.QueryProduct(ctx, id)
        if dbErr != nil {
            return nil, dbErr
        }

        // 3. Store with randomized jitter to prevent synchronous re-expiration
        jitteredTTL := 3600*time.Second + time.Duration(time.Now().UnixNano()%300)*time.Second
        _ = s.cache.Set(ctx, cacheKey, prod, jitteredTTL)

        return prod, nil
    })

    if err != nil {
        return nil, err
    }
    return val.(*Product), nil
}
2. Probabilistic Early Cache Expiration (XFetch Algorithm)
Uniform TTLs guarantee synchronized stampedes. The XFetch algorithm (Vattani et al.) computes whether a worker should proactively recompute the cache before it expires based on compute time, remaining TTL, and random probability:
$\text{Recompute if: } -\beta \times \delta \times \ln(\text{rand}()) > \text{remaining_TTL}$
# xfetch_cache.py
import math
import random
import time

def should_recompute(delta_compute_time: float, ttl_remaining: float, beta: float = 1.0) -> bool:
    """
    Implements optimal probabilistic cache refresh (XFetch).
    delta_compute_time: Time in seconds it takes to fetch/calculate from DB.
    ttl_remaining: Seconds remaining before cache key expiration.
    beta: Aggressiveness factor (> 1.0 refreshes earlier; < 1.0 refreshes later).
    """
    if ttl_remaining <= 0:
        return True

    # -beta * delta * ln(random(0, 1))
    probabilistic_threshold = -beta * delta_compute_time * math.log(random.random())
    return probabilistic_threshold >= ttl_remaining
3. Database Connection Pooling (pgbouncer.ini)
Direct container connections to PostgreSQL create exponential connection overhead and process-fork contention. We installed PgBouncer to queue spikes safely:
# /etc/pgbouncer/pgbouncer.ini
[databases]
production_db = host=127.0.0.1 port=5432 dbname=production_db

[pgbouncer]
listen_addr = 0.0.0.0
listen_port = 6432
auth_type = scram-sha-256
auth_file = /etc/pgbouncer/userlist.txt

# Transaction pooling: connection is returned to pool immediately after transaction commits
pool_mode = transaction
max_client_conn = 10000
default_pool_size = 150
reserve_pool_size = 20
reserve_pool_timeout = 5.0
max_db_connections = 180

# Timeouts
query_timeout = 15.0
idle_transaction_timeout = 30.0
7. Production War Story 2: “The Poison Pill in Kafka”
Let’s examine a second, equally perilous failure mode: an event-driven Cascading Deserialization Death.
                           THE POISON PILL CASCADE

   [ Payment Service ] ---> Produces event with invalid schema {"amount": "NaN"}
                                      |
                                      v
                             [ Kafka Topic: payments ]
                                      |
                                      +------------------------------------+
                                      |                                    |
                                      v                                    v
                           [ Worker Pod 1 ]                     [ Worker Pod 2 ]
                           Deserialization Panic!               Deserialization Panic!
                           CrashLoopBackOff                     CrashLoopBackOff
                                      |                                    |
                                      +-----------------+------------------+
                                                        |
                                                        v
                                         [ Consumer Group Collapses ]
                                         Lag reaches 12,000,000 events
The Scenario
At 14:10 UTC, an external payment vendor updated their webhook payload to serialize currency values as "NaN" instead of 0.00.
- The ingest service accepted the payload and published it directly onto the internal
payments.eventsKafka topic. - A pool of 60 Kubernetes consumer pods pulled the record. Upon parsing
"NaN"into a 64-bit float, the parser threw an unhandled runtime panic. - The pods crashed without committing the Kafka offset.
- Kubernetes restarted the pods. Upon restart, the consumer group rebalanced, resumed at the exact same uncommitted offset, read the identical record, and crashed again.
- Within 90 seconds, all 60 consumer pods entered
CrashLoopBackOff. Consumer lag skyrocketed to millions of records, halting fulfillment nationwide.
The Naive Reaction vs. The Blameless Resolution
- The Naive Reaction: Blame the developer who wrote the Go consumer for not wrapping the parser in a
recover()block, and reprimand the vendor integration team. - The Blameless Systemic Fixes:
- Dead Letter Queue (DLQ) with Circuit Breaker: Consumers must isolate unprocessable poison pills without crashing or blocking the partition stream:
// consumer_safe.go
func (c *EventConsumer) ProcessMessage(ctx context.Context, msg *kafka.Message) error {
    var event PaymentEvent

    // Attempt deserialization
    if err := json.Unmarshal(msg.Value, &event); err != nil {
        log.Printf("POISON PILL DETECTED at offset %d: %v. Rerouting to DLQ.", msg.Offset, err)

        // Forward unparseable raw payload to Dead Letter Queue for offline analysis
        if dlqErr := c.dlqProducer.Publish(ctx, "payments.events.dlq", msg.Value, err.Error()); dlqErr != nil {
            return dlqErr // Halt only if DLQ broker itself is unreachable
        }

        // Commit offset to avoid blocking downstream partition traffic
        return c.consumer.CommitMessage(msg)
    }

    return c.handler.Execute(ctx, event)
}
- Schema Registry Validation: Eliminate raw JSON on Kafka topics. Enforce Apache Avro or Protocol Buffers with a strict Schema Registry (
Confluent Schema Registry/Buf) that rejects messages at produce-time if they violate the contractual schema.
8. Managing Up: High-Trust Stakeholder & Executive Communications
One of the most destructive disruptions during a SEV-1 incident is an anxious executive entering the technical war room and demanding: “When will it be fixed?” every five minutes.
Responders become distracted, the Incident Commander loses rhythm, and engineers start making reckless guesses to appease leadership.
To protect responders, the Communications Lead must establish an asynchronous, high-trust communication protocol:
+---------------------------------------------------------------------------------------------------+
|                            THE 3-PART EXECUTIVE STATUS UPDATE FORMULA                             |
|                                                                                                   |
|  1. CURRENT IMPACT & BLAST RADIUS                                                                 |
|     - Plain language: who is affected, what business workflows are degraded.                      |
|                                                                                                   |
|  2. MITIGATION ACTIONS UNDERWAY                                                                   |
|     - Focus on active containment steps, not speculative debugging theories.                      |
|                                                                                                   |
|  3. NEXT UPDATE WINDOW (THE TIME-LOCK)                                                            |
|     - "The next update will be provided at 14:30 UTC or upon significant status change."         |
|     - Explicitly frees leadership from asking for micro-updates.                                  |
+---------------------------------------------------------------------------------------------------+
Ready-to-Use Executive Broadcast Templates
Template 1: Initial Executive Notification (T+15 Minutes)
[INCIDENT STATUS: SEV-1] Payment Processing Degradation
* Time Sent: 14:15 UTC
* Incident Commander: @alex
* Communications Lead: @carol

SUMMARY:
At 14:02 UTC, automated monitoring detected elevated HTTP 504 errors on the checkout payment gateway.
Approximately 65% of credit card transactions in North America are currently failing.

CURRENT ACTIONS:
* The incident command team is mobilized on bridge #inc-sev1-payments.
* Operations is executing an immediate rollback of Release v2.14.0 deployed earlier this hour.
* Third-party payment gateways (Stripe, Adyen) report normal external operations.

NEXT UPDATE:
An update will be posted here at 14:30 UTC, or sooner if service is restored.
Template 2: Public Status Page Update (status.company.com)
- ❌ Bad (Vague & Frustrating): “We are investigating technical difficulties. Thanks for your patience.”
- ✅ Good (Transparent, Empathetic & Actionable): “We are currently experiencing elevated failure rates for customer checkout transactions in North America. Our engineering team is actively rolling back a recent platform update to restore stability. Users can safely retry completed orders once service is restored. We will provide our next update within 30 minutes.”
9. Conversational Judo: The Post-Mortem Facilitator’s Playbook
Conducting a genuinely blameless post-mortem meeting requires active conversational facilitation. When tension runs high, participants naturally slip into defensive postures.
The Opening Charter (Read Aloud at Minute Zero)
“We are here to understand how our systems, tools, processes, and knowledge failed us during this incident. We operate under the foundational belief that everyone involved acted with the best intentions and made the best choices they could with the information they had. We are not here to assign blame, evaluate personal competence, or seek retribution. We are here to uncover systemic vulnerabilities and engineer permanent resilience.”
The Counterfactual Rule: Banning “Could Have / Should Have”
In a blameless post-mortem, the facilitator must actively interdict counterfactual statements. Counterfactuals explain what didn’t happen in an imaginary alternate universe, rather than what did happen in this one.
+---------------------------------------------------------------------------------------------------+
|                               CONVERSATIONAL JUDO: FACILITATOR PHRASEBOOK                         |
|                                                                                                   |
|  COUNTERFACTUAL / BLAME PHRASING          | BLAMELESS SYSTEMIC REFRAMING                          |
+-------------------------------------------+-------------------------------------------------------+
|  "Why didn't you test this on staging?"   | "What signals or conditions gave the team confidence  |
|                                           | to proceed directly with production deployment?"      |
+-------------------------------------------+-------------------------------------------------------+
|  "Who approved this pull request?"        | "What automated guardrails or context were missing    |
|                                           | during the code review process?"                      |
+-------------------------------------------+-------------------------------------------------------+
|  "Why did it take 45 minutes to notice?"  | "What were the primary dashboards and monitors        |
|                                           | displaying during the initial 45 minutes?"            |
+-------------------------------------------+-------------------------------------------------------+
|  "You should have known that table was    | "How is table schema dependency currently communicated|
|   shared."                                | across our service boundaries?"                       |
+-------------------------------------------+-------------------------------------------------------+
The Executive Intercept Protocol
Occasionally, an aggressive senior executive or business leader will join the review and demand: “Who is responsible for this, and what disciplinary action is being taken?”
The facilitator must execute the Executive Intercept Protocol:
“We understand the severity of this outage and its impact on our customers and revenue. In safety-critical engineering, the fastest way to guarantee this outage happens again is to punish the individuals involved. Punishment teaches engineers to hide near-misses, delay incident escalation, and censor system logs. Our goal today is to invest in systemic resilience so that regardless of who is on call, this entire category of failure is architecturally impossible. We invite you to stay and help us prioritize those engineering safeguards.”
10. Beyond the “5 Whys”: Multi-Causal Systemic Analysis
While the “5 Whys” methodology is widely cited, it has a fatal flaw in complex distributed systems: it presumes a linear causal chain.
THE LINEAR "5 WHYS" TRAP:
1. Why did the API crash?              -> The database ran out of connections.
2. Why did it run out of connections?  -> There was a traffic spike.
3. Why was there a traffic spike?      -> An unannounced promotional campaign launched.
4. Why was it unannounced?             -> Marketing forgot to tell Engineering.
5. Why did they forget?                -> John didn't send the briefing email.
--> Bogus Conclusion: "John needs to send better emails."
In reality, incidents are web-like networks of interacting factors. Instead of a linear chain, use a Multi-Causal Systems Diagram (How-Why Tree / Fishbone):
                                  MULTI-CAUSAL SYSTEMIC NETWORK

       [ Latent Technical Debt ]               [ Observability Blindspots ]
       - No connection pooling (PgBouncer)     - Missing alert on cache hit ratio drop
       - Hardcoded TTLs without jitter         - Dashboards split across two separate tools
                  \                                      /
                   \                                    /
                    v                                  v
              ====================================================
                             PRODUCTION OUTAGE:
                       PAYMENT GATEWAY DEGRADATION
              ====================================================
                    ^                                  ^
                   /                                    \
                  /                                      \
       [ Process & Communication ]              [ Operational Guardrails ]
       - Marketing & Eng launch silos           - Dangerous commands unhedged by CLI tools
       - Runbooks outdated by 6 months          - Staging environment didn't mirror prod scale
11. Action Items That Actually Work: The Hierarchy of Controls
The true test of a post-mortem is whether its Action Items prevent recurrence or merely create administrative busywork.
In industrial safety engineering, the Hierarchy of Controls categorizes safety interventions from most effective to least effective. We can adapt this directly to software architecture:
+---------------------------------------------------------------------------------------------------+
|                            THE SOFTWARE SAFETY HIERARCHY OF CONTROLS                              |
|                                                                                                   |
|  [ MOST EFFECTIVE ]                                                                               |
|                                                                                                   |
|  1. ELIMINATION / SUBSTITUTION                                                                    |
|     - Architecturally remove the hazard entirely.                                                 |
|     - Example: Migrate from raw SQL strings to type-safe ORMs; eliminate shared passwords in      |
|       favor of ephemeral IAM / SPIFFE identities.                                                 |
|                                                                                                   |
|  2. ENGINEERING CONTROLS                                                                          |
|     - Automated technical barriers that catch mistakes before they impact production.             |
|     - Example: Add PgBouncer connection queuing, enforce `singleflight` caching, implement        |
|       automated canary analysis with Prometheus rollbacks in ArgoCD.                              |
|                                                                                                   |
|  3. DETECTIVE CONTROLS                                                                            |
|     - Telemetry that minimizes Time to Detect (MTTD) and alerts responders before outages.        |
|     - Example: Add high-priority PagerDuty alerts on SLO burn rates, synthetic canary pingers.    |
|                                                                                                   |
|  4. ADMINISTRATIVE CONTROLS                                                                       |
|     - Documentation, checklists, and manual procedural standards.                                 |
|     - Example: Update the disaster recovery runbook; conduct an on-call architecture review.      |
|                                                                                                   |
|  5. HUMAN VIGILANCE (HOPE AS A STRATEGY)                                                          |
|     - "Tell engineers to be more careful"; "Require a second pair of eyes on deploys."            |
|     - Verdict: COMPLETELY INEFFECTIVE. Fails under fatigue, stress, and time pressure.            |
|                                                                                                   |
|  [ LEAST EFFECTIVE ]                                                                              |
+---------------------------------------------------------------------------------------------------+
The Post-Mortem Action Item Anti-Pattern Hall of Shame
| Broken Anti-Pattern Action Item | Why It Fails | The High-Leverage Replacement |
|---|---|---|
| “Remind developers to test database migrations before deploying.” | Humans forget under stress and fatigue. Zero enforcement. | Add automated GitHub Actions step running pg-schema-diff against a clone of production schema. |
| “Update the incident runbook.” | Runbooks become stale the instant they are written. Responders don’t read docs during high-stress outages. | Convert runbook into an automated remediation script or Kubernetes operator. |
| “Mandate VP approval for all Friday afternoon deploys.” | Slows down velocity, increases batch size, and turns deployments into high-risk events. | Implement automated progressive canary rollouts (Argo Rollouts) that automatically rollback on metric anomalies. |
| “Require developers to double-check Redis flush commands.” | Simple typos happen. | In redis.conf, enforce rename-command FLUSHALL "" and rename-command FLUSHDB "" to permanently disable catastrophic commands. |
12. Production Automation: The SRE War Room Toolbelt
High-performing teams eliminate friction during both incident mobilization and post-mortem retrospective construction using lightweight automation scripts.
Tool 1: Automated Incident Initializer (incident-init.sh)
Spins up the war room, creates the channel, and initializes the local tracker in under 3 seconds:
#!/usr/bin/env bash
# ==============================================================================
# incident-init.sh - Automated Incident War Room & Tracking Initializer
# ==============================================================================
set -euo pipefail

SEVERITY="${1:-}"
TITLE="${2:-}"

if [[ -z "$SEVERITY" || -z "$TITLE" ]]; then
    echo "Usage: ./incident-init.sh <SEV-1|SEV-2|SEV-3> <Incident-Short-Title>"
    echo "Example: ./incident-init.sh SEV-1 payment-gateway-504s"
    exit 1
fi

TIMESTAMP=$(date -u +"%Y%m%d-%H%M")
CHANNEL_NAME="inc-${SEVERITY,,}-${TIMESTAMP}-${TITLE}"
MEETING_URL="https://meet.internal.net/${CHANNEL_NAME}"

echo "======================================================================"
echo "⚡ INITIALIZING INCIDENT COMMAND: [${SEVERITY}] ${TITLE}"
echo "======================================================================"

cat <<EOF
[+] Incident Details:
    - Severity:       ${SEVERITY}
    - Channel Name:   #${CHANNEL_NAME}
    - War Room Audio: ${MEETING_URL}
    - Initialized At: $(date -u +"%Y-%m-%d %H:%M:%S UTC")

[+] Immediate Command Checklist:
    1. Incident Commander (IC): Declare "I have command" in #${CHANNEL_NAME}.
    2. Assign Operations Lead:  Direct technical diagnosis.
    3. Assign Comms Lead:       Post initial status update within 15 minutes.
    4. Assign Scribe:           Log key decisions, timestamps, and graphs.
======================================================================
EOF

INCIDENT_DOC="incident-${TIMESTAMP}-${TITLE}.md"
cat <<EOF > "${INCIDENT_DOC}"
# [INCIDENT TRACKER] ${SEVERITY}: ${TITLE}
* **Status**: ACTIVE INVESTIGATION
* **Severity**: ${SEVERITY}
* **Declared (UTC)**: $(date -u +"%Y-%m-%d %H:%M:%S UTC")
* **War Room Bridge**: ${MEETING_URL}

## Responders
* **Incident Commander**: @
* **Operations Lead**: @
* **Communications Lead**: @
* **Scribe**: @

## Live Timeline (UTC)
* $(date -u +"%H:%M UTC") - Incident declared. War room initialized.
EOF

echo "[✓] Local tracker initialized: ${INCIDENT_DOC}"
Tool 2: Post-Mortem Timeline Harvester (harvest_timeline.py)
One of the most time-consuming aspects of compiling a post-mortem is manually assembling timestamps across chat history.
This Python utility parses exported Slack channel JSON files or message dumps and outputs a formatted, clean Markdown timeline table:
#!/usr/bin/env python3
"""
harvest_timeline.py - Extract and format incident war room chat into Markdown timeline tables.
Usage: python3 harvest_timeline.py slack_dump.json
"""
import sys
import json
from datetime import datetime, timezone

def parse_slack_export(file_path: str):
    with open(file_path, "r", encoding="utf-8") as f:
        messages = json.load(f)

    # Sort chronologically
    messages = sorted(messages, key=lambda m: float(m.get("ts", 0)))

    print("| Timestamp (UTC) | Author | Event / Observation | Key Artifact / Link |")
    print("| :--- | :--- | :--- | :--- |")

    for msg in messages:
        # Filter out purely automated joining messages
        subtype = msg.get("subtype", "")
        if subtype in ["channel_join", "channel_leave"]:
            continue

        ts = float(msg.get("ts", 0))
        dt = datetime.fromtimestamp(ts, tz=timezone.utc)
        time_str = dt.strftime("%Y-%m-%d %H:%M:%S")
        user = msg.get("user_profile", {}).get("real_name", msg.get("user", "Unknown"))
        text = msg.get("text", "").replace("\n", " ").strip()

        # Sanitize pipe symbols for Markdown table compatibility
        text = text.replace("|", "\\|")

        if len(text) > 140:
            text = text[:137] + "..."

        print(f"| {time_str} | **@{user}** | {text} | |")

if __name__ == "__main__":
    if len(sys.argv) < 2:
        print("Usage: python3 harvest_timeline.py <slack_messages.json>")
        sys.exit(1)
    parse_slack_export(sys.argv[1])
13. The Production-Ready Blameless Post-Mortem Template
Below is an enterprise-grade, battle-tested Markdown post-mortem template. Copy this directly into your engineering documentation system (Git, Notion, or Confluence).
# [INCIDENT REPORT] YYYY-MM-DD: <Short Descriptive Title>

## 1. Incident Overview & Metadata
* **Status**: [Investigating | Mitigated | Resolved]
* **Severity Level**: [SEV-1 | SEV-2 | SEV-3]
* **Incident Commander**: @username
* **Operations Lead**: @username
* **Communications Lead**: @username
* **Scribe**: @username
* **Incident Slack Channel**: #incident-YYYYMMDD-title
* **Incident Bridge / War Room Link**: https://meet.company.com/incident-id

### Timeline Milestones (UTC)
* **Start of Degradation**: YYYY-MM-DD HH:MM UTC
* **Detection Time (Alert Fired)**: YYYY-MM-DD HH:MM UTC (MTTD: XX min)
* **First Responder Acknowledged**: YYYY-MM-DD HH:MM UTC (MTTA: XX min)
* **Mitigation Achieved**: YYYY-MM-DD HH:MM UTC (MTTM: XX min)
* **Full Incident Resolution**: YYYY-MM-DD HH:MM UTC (MTTR: XX min)

---

## 2. Executive Summary
*Provide a 2–3 paragraph high-level summary readable by non-technical leadership.*
*What happened, what was the customer and financial impact, how did we stabilize it, and what are the primary systemic investments being made to prevent recurrence?*

---

## 3. Customer & Business Impact
* **User-Facing Degradation**: (e.g., "65% of checkout transactions returned HTTP 500 errors between 14:10 and 14:45 UTC.")
* **SLO / Error Budget Burn**: (e.g., "Consumed 42% of our monthly 99.9% Availability Error Budget.")
* **Financial / Operational Impact**: (e.g., "Estimated $18,000 in delayed transactions; 240 support tickets filed.")
* **Data Integrity**: [No data loss | Data reconstructed from Kafka | Permanent loss]

---

## 4. Chronological Incident Timeline
*Record detailed, timestamped events in UTC. Include metric graphs, screenshots, and pull request links.*

* **14:02 UTC** - Deployment `v2.14.0` initiated via CI/CD pipeline by automated release bot.
* **14:08 UTC** - Deployment completes across 100% of production Kubernetes pods in `us-east-1`.
* **14:12 UTC** - Datadog synthetic pinger triggers `Alert_Checkout_Latency_P99 > 2000ms`.
* **14:15 UTC** - On-call engineer (@sarah) acknowledges alert and joins `#incident-war-room`.
* **14:18 UTC** - @sarah declares SEV-1 incident; @alex assumes Incident Commander role.
* **14:24 UTC** - Initial hypothesis: Database deadlocks. Ops lead discovers connection pool exhaustion.
* **14:31 UTC** - IC authorizes rollback to `v2.13.9`.
* **14:38 UTC** - Rollback completes. Error rates decline from 65% to 0.2%.
* **14:45 UTC** - Metrics stabilize across all regions. IC declares incident mitigated.

---

## 5. Systemic Contributing Factors

### 1. The Trigger
*What was the immediate perturbation that destabilized the system?*
*(e.g., Unjittered cache key expiration, configuration typo, unexpected payload volume).*

### 2. Detection Gaps
*Why didn't we detect this in staging or canary testing?*
*(e.g., Staging lacked realistic traffic volume; canary metrics evaluated HTTP 200 count rather than P99 latency).*

### 3. Latent Architectural Conditions
*What existing technical debt or design trade-offs allowed this failure to spread?*
*(e.g., Direct database connections without a connection pooler; missing circuit breaker pattern on API calls).*

### 4. Operational & Tooling Friction
*What slowed down responders during the incident?*
*(e.g., Slow rollback pipelines taking 14 minutes; dashboard access permissions expired for on-call engineer).*

---

## 6. Where We Got Lucky (Serendipity Analysis)
*What went right? What circumstances prevented this incident from being significantly worse?*
*(e.g., The incident occurred at 2:00 PM rather than 2:00 AM; a senior database engineer happened to be at their desk).*

---

## 7. Corrective Action Items (Remediation)

| Action Item Description | Category | Priority | Assignee | Ticket Link | Target Date |
| :--- | :--- | :--- | :--- | :--- | :--- |
| Implement PgBouncer connection pooling | Engineering Control | P1 | @dave | PROJ-1402 | 2026-10-05 |
| Enforce automated jitter in core caching library | Elimination | P1 | @elena | PROJ-1403 | 2026-10-08 |
| Add P99 latency canary analysis step to ArgoCD | Detective Control | P2 | @alex | PROJ-1404 | 2026-10-15 |
| Update Database Recovery Runbook with triage tree | Administrative | P3 | @sarah | PROJ-1405 | 2026-10-22 |
14. On-Call Ergonomics: Protecting the Human in the Loop
Resilience engineering recognizes that human operators are the ultimate safety buffer in complex systems. However, chronic fatigue and unconstrained alert noise degrade human cognition to the point where mistakes become inevitable.
The Rule of Two (Alert Fatigue Threshold)
- Maximum 2 Actionable Pages per 12-Hour Shift: If an on-call rotation averages more than 2 pages per shift, the rotation is declared toxic.
- Mandatory Operational Handoff: When a service’s pager load exceeds safe thresholds, primary on-call responsibilities automatically transfer to the engineering manager and team lead. Feature work is paused until noisy alerts are remediated and the system stabilizes.
Post-Incident Responder Care (Compensatory Rest)
If an engineer spends more than 2 hours responding to a SEV-1 incident between 22:00 and 06:00, they are barred from working the following day. No meetings, no standups, no code reviews. Organizations that celebrate engineers who work 24 hours straight are not heroic—they are actively inviting their next catastrophic outage.
Production On-Call Shift Handover Report Template
# [ON-CALL HANDOVER] Shift: YYYY-MM-DD to YYYY-MM-DD
* **Outgoing Primary**: @outgoing_engineer
* **Incoming Primary**: @incoming_engineer
* **Service Tier**: Tier-1 Core Infrastructure

## 1. Pager Load Summary
* Total Pages Received: 4
* Actionable Alerts: 2 (SEV-2 Payment Latency, SEV-3 Kafka Lag)
* False Positives / Flapping Alerts: 2 (Disk I/O Spike on node-42 -> JIRA-881 filed to tune threshold)

## 2. Active Incidents & Ongoing Investigations
* [INC-892] Memory leak on auth-service v2.12. Responders scheduled nightly restart cron as temporary containment; Root cause PR #941 pending merge.

## 3. High-Risk Upcoming Changes
* Database Schema migration scheduled for Thursday 22:00 UTC (PROJ-2041).
15. Proactive Resilience: The Wheel of Misfortune & GameDays
You cannot build a high-performance incident response organization by waiting for production to explode at 3:00 AM.
Pioneered by reliability engineering teams at Google and Etsy, the Wheel of Misfortune is an interactive role-playing simulation designed to train incident commanders, test runbooks, and normalize blameless culture in a safe, controlled environment.
+-----------------------------------------------------------------------------------------------+
|                                  THE WHEEL OF MISFORTUNE DRILL                                |
|                                                                                               |
|   1. THE ARCHITECT (Game Master)       2. THE VICTIM (Responder)      3. THE TEAM (Audience)  |
|   - Selects a past real-world outage   - Plays Incident Commander     - Observes, takes       |
|     or crafts a synthetic chaos        - Queries the Game Master:      notes, and provides    |
|     scenario.                            "What does Datadog show?"     constructive feedback. |
|   - Controls dashboard state & telemetry. "I run `kubectl describe`." - Shares in the learning|
|   - Injects unexpected twists & curve-  "I page the DBA lead."          without the 3 AM      |
|     balls into the simulation.                                          adrenaline spike.     |
+-----------------------------------------------------------------------------------------------+
How to Run a 45-Minute Drill:
- Scenario Selection: The Game Master selects an incident from six months ago (e.g., DNS resolver timeout, TLS certificate expiration, split-brain Kafka partition).
- The Prompt: The Game Master sends a simulated PagerDuty ping to the designated responder.
- Investigation via Dialogue: The responder states their diagnostic steps:
- Responder: “I check the ingress error rate graph.”
- Game Master: “The ingress dashboard shows a spike in HTTP 502s from the checkout service, but authentication is healthy.”
- Responder: “I check the checkout pod logs for exceptions.”
- Game Master: “You see
java.net.SocketTimeoutException: Read timed outconnecting to Redis.”
- Debrief: Review the response. Did the engineer fall into the diagnostic trap? Was communication clear? Were runbooks accurate?
Conducting regular GameDays transforms on-call duty from a terrifying ordeal into a practiced, collaborative team discipline.
16. The 25-Point Incident Response & Post-Mortem Checklist
Print this reference card or pin it in your engineering handbook for instant access during critical operations:
Phase 1: Incident Declaration & Mobilization
- 1. Severity Classification: Identify customer impact and assign initial severity (
SEV-1throughSEV-4). - 2. Rapid War Room Provisioning: Run
./incident-init.shto spin up Slack channel, war room audio bridge, and tracking document. - 3. Establish Incident Command: Explicitly designate the Incident Commander (IC). IC confirms: “I have command.”
- 4. Appoint Triad Leads: Appoint Operations Lead, Communications Lead, and Scribe.
- 5. Radio Silence & Guarding Rhythm: Silence extraneous alerts and prevent chatter in the primary command channel.
Phase 2: Triage & Tactical Containment
- 6. Containment Over Diagnosis: Prioritize containment over root-cause investigation (Mitigate first, debug later).
- 7. Assess Recent System Perturbations: Identify recent changes (deploys, feature flags, infrastructure upgrades, DNS records).
- 8. Execute Mitigation: Execute rollback, circuit-breaking, or traffic-shedding if applicable.
- 9. Stakeholder Broadcast: Communications Lead posts initial internal update (within 15 minutes for
SEV-1). - 10. Public Status Page: Update public status page if user impact is verified. Avoid speculation and technical jargon.
Phase 3: Resolution & Steady-State Verification
- 11. Telemetry Verification: Verify service health using baseline metrics (P99 Latency, Error Rate, Request Throughput).
- 12. Support Queue Confirmation: Confirm with customer support that user failure reports have ceased.
- 13. De-escalate & Stand Down: Teardown emergency war room and restore standard monitoring alert thresholds.
- 14. Stakeholder Debrief: Post “Incident Mitigated” summary to stakeholders.
- 15. Responder Care & Comp Time: Grant mandatory compensatory rest to responders who worked overnight.
Phase 4: Blameless Post-Mortem & Continuous Learning
- 16. Schedule Review Rapidly: Schedule Post-Mortem review within 48 hours while memories and logs are fresh.
- 17. Timeline Compilation: Compile immutable timeline from Slack logs, commit histories, and monitoring graphs (
harvest_timeline.py). - 18. Read the Blameless Charter: Facilitator opens meeting with the Blameless Charter. Ban counterfactual questions (“could have / should have”).
- 19. Multi-Causal Systemic Mapping: Map contributing factors across technical debt, tooling, process, and detection.
- 20. Serendipity Analysis: Identify “Where We Got Lucky” to uncover hidden systemic resilience risks.
- 21. Hierarchy of Controls Action Items: Formulate SMART Action Items anchored in the Hierarchy of Controls (
P1–P3). - 22. Single-Owner Accountability: Assign every Action Item to a single named owner with a 30-day completion deadline.
- 23. Anti-Pattern Audit: Review Action Items against the Anti-Pattern Hall of Shame. Ban “Be more careful.”
- 24. Open Publication: Publish post-mortem openly across the engineering organization for shared learning.
- 25. Proactive GameDay: Schedule an upcoming Wheel of Misfortune drill to test new runbooks and controls.
Conclusion: Culture is Built in the Shadows of Failure
When systems are operating normally and dashboards are green, it is easy to champion collaboration, psychological safety, and empathy.
The true cultural DNA of an engineering organization is revealed during the chaotic, high-stakes minutes of a catastrophic outage.
If your organization responds to disaster with finger-pointing, disciplinary demotions, and defensive silos, your systems will inevitably become fragile, opaque, and prone to repeated crises.
When you treat incidents as unplanned investments in system telemetry, empower responders with a structured incident command hierarchy, and analyze failures through a rigorously blameless lens, outages transform from terrifying emergencies into your most valuable engineering education.
Build systems that expect failure. Foster teams that learn from it. And make blamelessness your core design architecture.