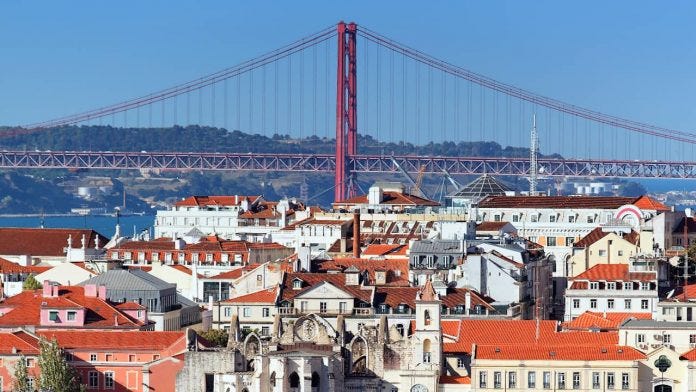
The Lisbon Metropolitan Area (Área Metropolitana de Lisboa - AML) in Portugal is widely renowned for its rich ethnic, linguistic, and cultural diversity. For centuries, it has served as an Atlantic crossroads connecting Europe, Africa, the Americas, and Asia. Today, this heritage remains one of the defining characteristics of modern Lisbon.
During my months living in Lisbon, the demographic diversity on the streets was immediately striking—even more pronounced than in Florianópolis, Santa Catarina (Brazil), where I spent most of my life. Walking through the city, one encounters both multi-generational Portuguese citizens of immigrant descent seamlessly integrated into civic life, alongside new waves of international arrivals choosing Lisbon as their new home.
From French and German digital nomads and retirees gazing over the Tagus River on the train from Cais do Sodré to Cascais, to vibrant Angolan, Mozambican, and Cape Verdean communities in Almada; from South Asian and Chinese entrepreneurship in Arroios and Martim Moniz; to Brazilians who form an integral presence across every corner of the metropolis—the cultural mosaic is undeniable.
To better understand this demographic landscape and share reproducible data workflows, this article analyzes the final results of Portugal’s 2021 Census (Censos 2021), published by the National Statistics Institute (Instituto Nacional de Estatística - INE).
1. The Census 2021 Data Landscape
The final Census 2021 results were officially published on November 22, 2022. The release included an open data portal, an interactive Power BI dashboard, and fine-grained spatial reporting across three administrative levels:
- NUTS II (Regional macro-units)
- Municipality (Município / Concelho)
- Civil Parish (Freguesia) — the smallest administrative sub-district.
Notable Official References
- Censos 2021 Final Report (INE)
- Population Infographic Summary
- Housing & Household Structure
- GeoCensos 2021 Interactive Spatial Explorer
A Critical Methodological Limitation
A key observation regarding the individual questionnaire (Questionário Individual Censos 2021) is that it does not record self-identified race or ethnicity.
The Portuguese census records legal nationality and country of birth, but not ethnic identity. As a result, Portuguese citizens of second- or third-generation immigrant descent (who hold Portuguese citizenship) cannot be distinguished in nationality-based metrics. This represents an important blind spot for public policy researchers evaluating structural integration and representation.
Nonetheless, tracking non-national resident populations provides an empirical lens into the geographic settlement dynamics of international migration.
2. Geospatial Pipeline Architecture (Python & GeoPandas)
To map immigrant concentrations at the parish level, we merge INE demographic indicator 0011627 with the official administrative vector polygons (Carta Administrativa Oficial de Portugal - CAOP 2017) provided by dados.gov.pt.
Here is an improved, robust Python implementation using Pandas, GeoPandas, and Matplotlib:
import pandas as pd
import geopandas as gpd
import matplotlib.pyplot as plt
from typing import List

def analyze_immigrant_distribution(
    census_file: str,
    shapefile_dir: str,
    target_nationalities: List[str],
    districts: List[str] = ["LISBOA", "SETÚBAL"],
    output_image: str = "immigrant_map.png",
    colormap: str = "OrRd"
) -> gpd.GeoDataFrame:
    """
    Cleans census records, links them with CAOP administrative boundary polygons,
    computes per capita concentration metrics, and generates publication-grade choropleth maps.
    """
    # 1. Ingest Census demographic records
    df_census = pd.read_csv(census_file, sep="\t")

    # 2. Extract standard 6-digit parish code (cd_freg) from string
    df_census["cd_freg"] = df_census["Local de residência (à data dos Censos 2021)"].str[-7:-1]

    # 3. Extract total population per parish
    total_col = "2021 [S7A2021]-HM [T]-Total [T]-Total [T]"
    df_total = df_census[["cd_freg", total_col]].rename(columns={total_col: "pop_total"})

    # 4. Calculate total population for selected foreign nationalities
    df_foreign = df_census[["cd_freg"] + target_nationalities].copy()
    if len(target_nationalities) > 1:
        df_foreign["pop_foreign"] = df_foreign[target_nationalities].sum(axis=1)
    else:
        df_foreign["pop_foreign"] = df_foreign[target_nationalities[0]]

    # 5. Merge totals and compute percentage per capita
    df_merged = pd.merge(df_total, df_foreign[["cd_freg", "pop_foreign"]], on="cd_freg", how="inner")
    df_merged["pop_foreign_pct"] = (df_merged["pop_foreign"] / df_merged["pop_total"]) * 100

    # 6. Ingest CAOP geospatial polygons
    geo_df = gpd.read_file(shapefile_dir)
    geo_df = geo_df.iloc[:, [0, 2, 3, 7, 8]]
    geo_df.columns = ["cd_freg", "municipality", "district", "parish_name", "geometry"]

    # 7. Filter for Lisbon Metropolitan Area districts (Lisboa and Setúbal)
    geo_df = geo_df[geo_df["district"].isin(districts)].drop_duplicates(subset=["cd_freg"])

    # 8. Join spatial geometry with demographic indicators
    gdf = geo_df.merge(df_merged, on="cd_freg", how="inner")
    gdf = gdf.sort_values("pop_foreign_pct", ascending=False)

    # 9. Render Choropleth Map
    fig, ax = plt.subplots(figsize=(11, 7), dpi=300)
    gdf.plot(
        column="pop_foreign_pct",
        cmap=colormap,
        edgecolor="#333333",
        linewidth=0.4,
        legend=True,
        legend_kwds={
            "label": "Immigrant Population (% of Total Parish Population)",
            "orientation": "horizontal",
            "shrink": 0.65,
            "pad": 0.05
        },
        ax=ax
    )
    ax.set_axis_off()
    plt.tight_layout()
    plt.savefig(output_image, bbox_inches="tight")
    plt.close()

    return gdf
3. Spatial Distribution Patterns Across Communities
Analyzing different national groups reveals clear socio-spatial sorting across the metropolitan geography:
A. Western & Northern European Communities (Germany & France)
European residents from countries like Germany and France gravitate strongly towards prime historical centers and coastal resort towns. Many choose the region for retirement, high-quality leisure, or remote tech work.
- Top Parishes:
- São Vicente (Lisbon):
0.64% - Colares (Sintra):
0.63% - Cascais e Estoril (Cascais):
0.59% - Arroios (Lisbon):
0.58%
- São Vicente (Lisbon):
In no single parish do French or German residents exceed 1% of the total population, reflecting a dispersed footprint focused along the scenic Sintra-Cascais coastline and central Lisbon.

B. Lusophone African Nations (Angola, Cape Verde, Guinea-Bissau, Mozambique)
In sharp contrast to the European distribution, immigrants from the PALOP (Países Africanos de Língua Oficial Portuguesa) countries display high spatial concentration in peripheral suburban belts and along the southern bank (Margem Sul) of the Tagus:
- Top Parishes:
- Agualva e Mira-Sintra (Sintra):
7.36% - Águas Livres (Amadora):
6.35% - Baixa da Banheira e Vale da Amoreira (Moita, Setúbal):
5.99% - Massamá e Monte Abraão (Sintra):
5.17%
- Agualva e Mira-Sintra (Sintra):
The concentration here is significantly higher—reaching over 7% of total parish populations. This spatial clustering aligns with industrial commuter transit corridors, offering accessible housing near manufacturing, transport, and construction hubs.

C. Chinese Community
The Chinese diaspora exhibits a defined presence on the eastern flank of the city of Lisbon, centered around commercial trading zones and transportation nodes:
- Top Parishes:
- Parque das Nações (Lisbon):
1.50% - Arroios (Lisbon):
1.19% - Marvila (Lisbon):
1.06% - Santa Maria Maior (Lisbon):
0.94%
- Parque das Nações (Lisbon):
While Chinese communities operate businesses throughout Portugal, their residential clustering near Gare do Oriente and the central multicultural corridor of Arroios highlights proximity to wholesale markets, commercial storefronts, and international transit links.

D. The Brazilian Diaspora: Ubiquitous Presence
Brazilian nationals represent the single largest foreign community in Portugal by a wide margin. Unlike groups confined to specific suburban corridors or coastal enclaves, Brazilians are prominently represented across the entire metropolitan area—from historical cores to suburban commuter towns and coastal communities:
- Top Parishes:
- Costa da Caparica (Almada):
6.56% - São Vicente (Lisbon):
6.01% - Cascais e Estoril (Cascais):
5.98% - Encarnação (Mafra):
5.67% - Arroios (Lisbon):
5.62% - Ericeira (Mafra):
5.41%
- Costa da Caparica (Almada):
Across all civil parishes of Lisbon and Setúbal, Brazilian nationals average 2.98% per capita of the entire resident population. In absolute terms, the 2021 Census registered 92,321 Brazilian citizens in the Lisbon Metropolitan Area alone—a figure that has grown substantially in subsequent years.

4. Conclusion & Key Takeaways
The Lisbon Metropolitan Area’s cultural vitality is the product of long historical processes, economic globalization, and ongoing international migration.
- Spatial Sorting is Evident: High-income European migrants cluster along the scenic Cascais/Sintra coast, African diaspora communities have established deep roots in the industrial periphery of Amadora and Setúbal, Asian communities cluster around key urban commercial corridors, and Brazilians constitute a ubiquitous demographic force across the entire territory.
- Data-Driven Policy Needs: Geographic analysis of census microdata demonstrates why national averages fail to capture local realities. Municipalities like Amadora, Sintra, and Almada require public services tailored to significantly different demographic needs than coastal Cascais or northern Mafra.
- The Importance of Open GIS Data: Leveraging open administrative boundaries and modern Python libraries like GeoPandas transforms dense governmental census tables into intuitive visual evidence, democratizing access to urban analytics.